Indicators in Focus on Nemaska Lithium Inc. $NMX.ca
Separating the winners from the losers is a constant challenge for investors. Many focused investors may look to track stock momentum based on historical prices. Nemaska Lithium Inc. (TSX:NMX) currently has a 6 month price index of 1.08264. The six month price index is calculated by dividing the current share price by the share price six months ago. A ratio over one represents an increase in the stock price over the six month time frame. A ratio under one shows that the price has lowered over that defined time period.
We can also take a look at some stock volatility data on shares of Nemaska Lithium Inc. (TSX:NMX). The 12 month volatility is currently 79.689200. The 6 month volatility is noted at 76.539800, and the 3 month is recorded at 59.033400. When following the volatility of a stock, investors may be challenged with trying to decipher the correct combination of risk-reward to help maximize returns. As with any strategy, it is important to carefully consider risk and other market factors that might be in play when examining stock volatility levels.
Investors may be looking at the Piotroski F-Score when doing value analysis. The F-Score was developed to help find company stocks that have solid fundamentals, and to separate out weaker companies. Piotroski’s F-Score uses nine tests based on company financial statements. Nemaska Lithium Inc. (TSX:NMX) currently has a Piotroski F-Score of 2. One point is given for piece of criteria that is met. Typically, a stock with a high score of 8 or 9 would be seen as strong, and a stock scoring on the lower end between 0 and 2 would be viewed as weaker.
Shifting gears, Nemaska Lithium Inc. (TSX:NMX) has an FCF quality score of -4.349129. The free quality score helps estimate the stability of free cash flow. FCF quality is calculated as the 12 ltm cash flow per share over the average of the cash flow numbers. When reviewing this score, it is generally thought that the lower the ratio, the better. Presently, Nemaska Lithium Inc. has an FCF score of 0.713877. The FCF score is determined by merging free cash flow stability with free cash flow growth. In general, a higher FCF score value would represent high free cash flow growth. Monitoring FCF information may help provide some excellent insight on the financial health of a specific company.
Investors might want to take a look at shares of Nemaska Lithium Inc. (TSX:NMX) from a different angle. Let’s take a peek at the current Q.i. (Liquidity) Value. Nemaska Lithium Inc. (TSX:NMX) has a Q.i. value of 65.00000. This value ranks stocks using EBITDA yield, FCF yield, earnings yield and liquidity ratios. The Q.i. value may help identify companies that are undervalued. A larger value would indicate low turnover and a higher chance of shares being priced incorrectly. A lower value may show larger traded value meaning more sell-side analysts may track the company leading to a lesser chance that shares are priced improperly.
Source: http://stocknewsweek.com/indicators-in-focus-on-nemaska-lithium-inc-tsxnmx/14729.html
Read MoreIs This A Game Changer For Lithium Markets?
When we think of green technology, it’s not often that we picture it pertaining to the oil patch. However, the sector often doesn’t get credit for the massive amounts of innovation that it derives from the brain trusts that are employed by it.
While many consumers are slowly making the switch away from petroleum reliance, to lithium-ion battery powered vehicles, it may come as a surprise to them when they learn that a major breakthrough in lithium production may be bolstered by the big oil interests they’ve made a choice to avoid.
The key connection between these two groups is looking to come from a by-product both parties hold as a concern: brine water.
Often either reinjected into the ground, or stored in giant tanks, brine water is a problem in need of a solution in many parts of the sector. How it is dealt with is a major issue across the continent, when dealing with production of oil in a safe and efficient manner.
Read MoreThe World of EV’s Need Massive Supply of High Grade Lithium $FMR.ca $DGO.ca $BFF.ca $PFN.ca
Read MoreHigh-grade lithium and tantalum confirmed in NWT
92 Resources Corp. [NTY-TSXV] begun to release assay results from an extensive sampling program on its 100%-owned Hidden Lake lithium property within the central part of the Yellowknife Lithium Pegmatite Belt, Northwest Territories, Canada.
The 2016 summer exploration program included mapping and sampling of the LU D12 pegmatite, in addition to the newly discovered HL1, HL3 and HL4 pegmatites where spodumene, the hardrock ore of lithium, has been visually identified. Today’s results only include the LU D12 pegmatite with 85 samples collected from 15 channel samples. Additional assays from 223 samples from HL1, HL3 and HL4 are pending and are expected to be released shortly, respectively once received from the lab.
The best combination of grade and thickness from LU D12 returned an average of 1.53% Li2O and 64 ppm Ta2O5 over 11.58 metres, including 1.9% Li2O and 52 ppm Ta2O5 over 9.02 metres.
Of the 85 samples collected from the LU D12 pegmatite, a total of 52 returned greater than 1% Li2O, with 34 samples returning greater than 1.5% Li2O to a peak of 3.08% Li2O.
The company considers these results highly encouraging for the upcoming winter drill program, which may extend widths below surface even more.
For perspective, the Whabouchi deposit in Québec from Nemaska Lithium Inc. ($400 million CAD market cap.) averages about 1.5% Li2O. The James Bay deposit in Québec from Galaxy Resources Ltd. ($600 million AUD market cap.) averages about 1.3% Li2O (indicated) at a 0.75% Li2O cut-off. The Mt Cattlin deposit in Australia from Galaxy averages 1.1% Li2O. The Rose Lithium-Tantalum Deposit in Québec from Critical Elements Corp. ($79 million CAD market cap.) averages 0.98% Li2O and 163 ppm Ta2O5 (indicated).
The full report can be accessed with the following links:
English (PDF):
http://rockstone-research.com/images/PDF/92Resources7en.pdf
Read MoreAmerican Lithium reports additional near surface Lithium brine results from auger sampling at Fish Lake Valley North Playa – Grades of up to 426 mg/L Lithium
American Lithium reports additional near surface Lithium brine results from auger sampling at Fish Lake Valley North Playa – Grades of up to 426 mg/L Lithium
VANCOUVER, Nov. 3, 2016 /CNW/ – American Lithium Corp. (TSXV: Li) (OTCQB: LiACF) (Frankfurt: 5LA; WKN: A2AHEL) (“American Lithium” or the “Company”), is pleased to report a second round of results from near surface auger sampling on the North Playa, Fish Lake Valley, Esmeralda County, Nevada.
Highlights:
- Second successful shallow auger program at North Playa Fish Lake Valley, Nevada
- 26 of 29 shallow auger drill holes returning Lithium grades in excess of 150 mg/L; the average for all holes being 254 mg/L
- Continuation of excellent shallow Lithium mineralization and strong inverse relationship of high Lithium grades with low Magnesium grades
- 54 auger holes in total now completed by Company to date, demonstrating consistency of shallow high grade lithium enrichment across North Playa
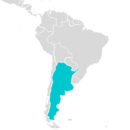
Midas Letter in Argentina: 650 million tonnes of lithium to be exploited
One is constantly having to remind one’s self that the lithium market is still only a few billion dollars annually in total market size. But that hasn’t stopped speculators from piling into the space in anticipation of increased consumption by anode and cathode makers in Korea, China and Japan.
It is important to note that manufacturers of batteries outside of Asia are mostly assemblers of battery components, and are not consumers of lithium directly.
Thus, while Tesla Motors continues to bamboozle market observers with paper offtake agreements and visits to the lithium triangle in South America, that is entirely a tactic, at this point, of an attempt to maintain stability in cathode costs by encouraging a robust expansion of lithium capacity — which is working — a bit.


